SELECT CASE STUDIES
FROM REAL WORLD IMPLEMENTATION
We know that CLV is a construct and metric that can enable firms to maximize customer profitability and augment firm and shareholder value. But how does this actually work in the real world? The following two case studies demonstrate the practical value of implementing CLV strategies, integrating extant marketing theory within each firm-specific context.
Case Study: IBM
The business problem:
IBM, a leading multinational, high-tech, B2B firm, faced challenges regarding the effectiveness of its customer contact strategy. Throughout the 1990s, they relied on a Customer Spending Score (CSS) to prioritize marketing communications to high-value customers. But this approach was soon abandoned, as it only focused on revenues and neglected the service costs. As an alternative, a CLV-based strategy was considered for scoring customers. In this regard, the following business challenges were identified (Kumar, V., Rajkumar Venkatesan, Timothy R. Bohling and Denise Beckmann (2008)):
• Which customers to select for targeting
• Is there a way to determine the level of resources to be allocated to those customers?
• How can the selected customers be nurtured in order to increase future profitability?
The solution:
Using data pertaining to IBM’s mid-market customers, a customer lifetime value (CLV) management framework was proposed and implemented in two stages. In the first stage, several models were developed to generate inputs for implementation. In the second stage, a field study was conducted based on recommendations from the models developed in the first stage. The CLV management framework is intended to guide the marketing activity directed towards customers each year.
How it works:
Stage 1 of the CLV framework comprised of the following 4 phases
Phase I:
Defined, and developed a model to measure CLV for each customer.
Phase II:
Conducted a prediction exercise to compare the performance of customer’s rank ordered based on the traditionally used metrics with that of CLV.
Phase III:
To maximize CLV, an optimal contact strategy was developed to allocate communication resources (i.e., channels of communication such as telephone, catalog, email, and direct mail) to each customer.
Phase IV:
Propensity models were built for each product category to identify the product to feature in addition to the CLV measure which helps to select the customers for targeting, and the optimization process which suggests the contact strategy.
Stage 2 of the CLV framework comprised of the following 2 phases.
Phase V:
Customers were split into two groups- (1) not contacted so far (Not Contacted until 2004 group), and (2) previously contacted (Contacted by 2004 group). Marketing contacts were then reallocated to align resources to the high CLV customers.
Phase VI:
Customers with potential for higher CLV but not contacted so far – i.e. the Not Contacted until 2004 group — were contacted in 2005 as per the recommendations of the CLV based approach. The performance of this group of customers was compared between the years 2004 and 2005 to illustrate the impact of the model recommendations. Further, the model recommendations were evaluated even for the intersection of the “Contacted by 2004” group and the Contacted in 2005 group to see if the suggested approach missed out on existing source of revenues. In other words, it was determined whether the recommendation that a certain customer be contacted in 2005, did in fact yield a higher revenue than the customers who were not contacted.
The impact:
The results revealed that, on average, the revenue from the customers who were Not Contacted Until 2004 but contacted in 2005 increased by 10 times (across all customers) as shown in the figure below.
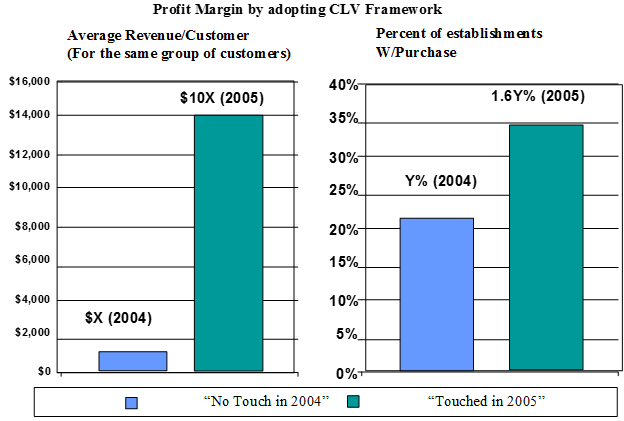
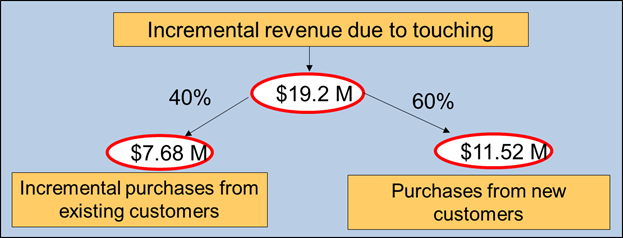
The net result was higher revenues, and higher value in 2005 (versus 2004) for the No Contact until 2004 but Contacted in 2005 group of customers. The total increase in revenues for the “No Contact until 2004 but Contacted in 2005” group of customers is about $19.2 million dollars. The following figure illustrates this finding.
The total revenue from the customers who were contacted in 2004 and 2005 (based on the model recommendations) was over 750 million dollars (after accounting for the direct marketing expenses). Therefore, the proposed model recommendations did not miss out on identifying existing sources of revenues but also identified new sources of revenues. The reallocation of marketing resources led to about a 3% increase in profits from 2004 to 2005 for the mid-market customers from contacting only 1% of the IBM customers. The impact of the CLV-based campaign on the profitability of mid-market customers has accelerated the adoption of the CLV management framework for other customer segments in IBM.
Reference
Kumar, V., Rajkumar Venkatesan, Timothy R. Bohling and Denise Beckmann (2008), “The Power of CLV: Managing Customer Lifetime Value at IBM,” Marketing Science, Vol. 27 (4), pp. 585-599.
Case Study: Fashion Retailer
The business problem:
A leading fashion retailer that sells apparel, shoes and accessories, for both men and women wanted to maximize their overall profitability by maximizing individual customer profitability, and deploy various customer level and store level marketing strategies. Specifically, the following challenges were identified (Kumar, V., Denish Shah, and Rajkumar Venkatesan (2006)):
• Develop a suitable metric to measure and manage customer level profitability
• Identify the right metric to manage customer loyalty
The solution:
A seven-step approach was adopted to answer the identified business challenges. To do so, a large sample of over 300,000 customers that made purchases from the retailer’s 30 retail outlets in USA between 2001 and 2004 was considered from the retailer’s customer database.
How it works:
Step One:
The first step was focused on evaluating the effectiveness of loyalty measures that the retailer was using. The retailer was using regularity of purchase, frequency of purchase, and tenure as an indicator of loyalty. A correlation study was done in order to test the effect of these measures of loyalty on the observed future profitability of the customers. The results showed the correlation to be very weak between the regularity and frequency of purchase and the future profitability of the customer. In light of this finding, the CLV metric was identified a more accurate predictor of future customer profitability.
Step Two:
The CLV for each customer was computed. To do so, the purchase frequency, contribution margin, and the marketing cost were estimated independently using appropriate models, and the resulting predictions from the three models were combined to arrive at a single value that represented the CLV in dollar terms.
Step Three:
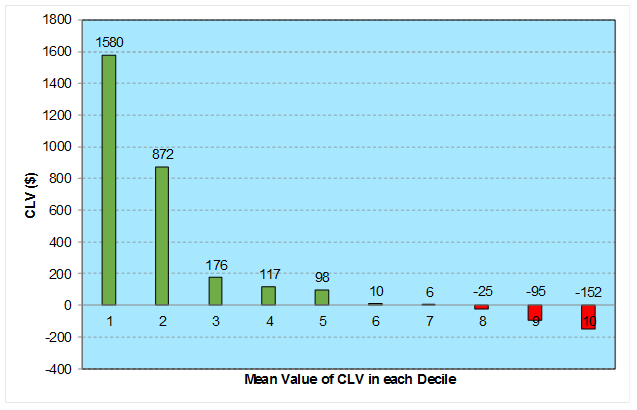
The computed CLV scores were used to rank-order all customers into deciles, where each decile represented 10% of the customer base. Based on the distribution of average CLV across deciles, the customer base into three segments: high CLV (comprising of Deciles 1 and 2), medium CLV (comprising of Deciles 3, 4, and 5) and low CLV (comprising of Deciles 6, 7, 8, 9, and 10). As illustrated in the figure below, it was observed that the top 20% of the customers accounted for 95% of the retailers’ profits, and the bottom 30% of the customers was actually creating losses for the retailer.
Step Four:
Given the CLV distribution score across customers, the areas where the retailer can derive maximum customer profitability were identified. This corresponded to identifying the following drivers of CLV (i.e., relationship duration and the variables used to compute the contribution margin and purchase frequency).
• Amount spent across all shopping channels (or multichannel shopping)
• Tenure of purchase with the retailer
• Amount spent in a specific product category
• Number of different product categories purchased (or cross-buying)
• Number of products returned by the customer between two purchases
Step Five:
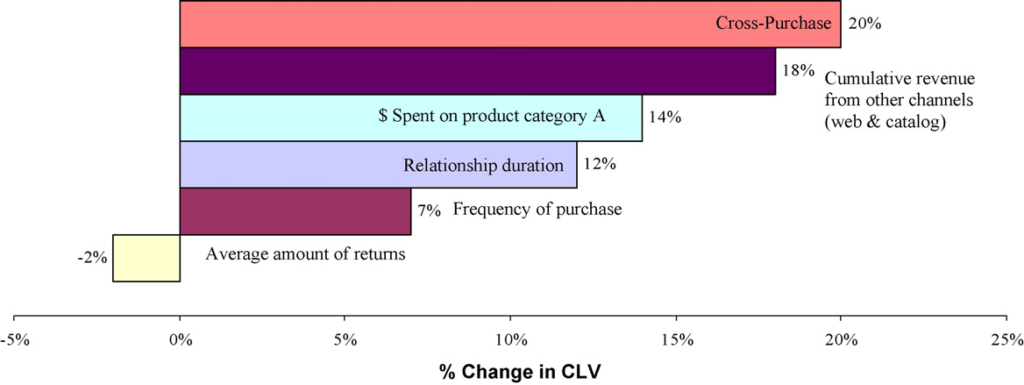
The effectiveness of each of the drivers was demonstrated. This was done by increasing the magnitude of each driver by 15% for the high CLV customers, and the corresponding expected increase in CLV in each customer was measured. For instance, by increasing the cross-buying behavior of high CLV customers by 15%, their CLV increased by 20%. The impact of the change in the CLV drivers is illustrated in the figure below.
Step Six:
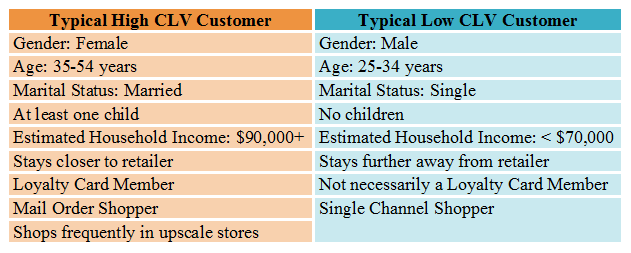
A profile analyses of the customers were performed for the high and low CLV groups (as shown in the table below). Based on the profile analyses, several segment-specific marketing strategies that were recommended to the firm.
Profile Analyses of High and Low CLV Customers
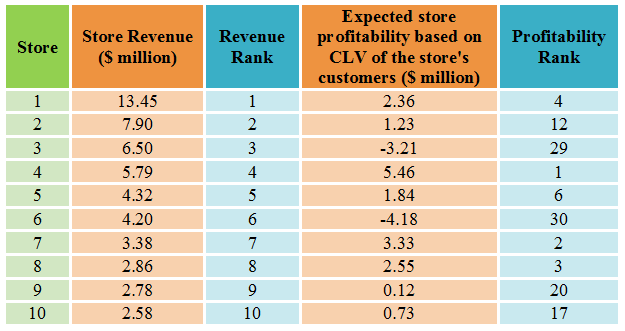
In the final step, the performance of each outlet of the retailer was evaluated using the CLV metric by assigning customer value weights to each store. Further, the stores were rank-ordered based on the sum of the lifetime value of the customers and their past revenue.
The impact:
Based on the store profitability analysis, the rank-order of the 30 outlets based on their lifetime value differed significantly from the rank-order based on past revenue. A similar discrepancy was observed when the past and future revenues of the customers were compared. This clearly shows that firms cannot rely on past store performance. The following table provides the comparison of store performance based on revenue and profitability (for the top 10 stores).
Comparison of store performance based on revenue and profitability
A key study implication corresponded to the acquisition and retention of the right customers. For instance, it was found that the store manager should not spend more than $176 per customer (on an average) for a customer to ensure a profitable lifetime duration with the customer. In acquiring new customers, this study identified that managers can refer to the profile of a typical high CLV customer and look for new customers with similar profiles, and prioritize their resources on these customers. In addition, this study identified other important tactical and strategic implications that retailers can use to manage and maximize customer profitability as well as store profitability.
Reference
Kumar, V., Denish Shah, and Rajkumar Venkatesan (2006), “Managing retailer profitability—one customer at a time!,” Journal of Retailing, 82 (4), 277-94.